


Chart Analysis #6 $SPX
HTF and LTF timeframes, Trading signal

In this blog, I will analyze several charts and pinpoint entry/exit points on various timeframes. For those needing to comprehend my trading strategy or the pro bundle, you can find the additional resources section at the bottom.
SPY 0.00%↑
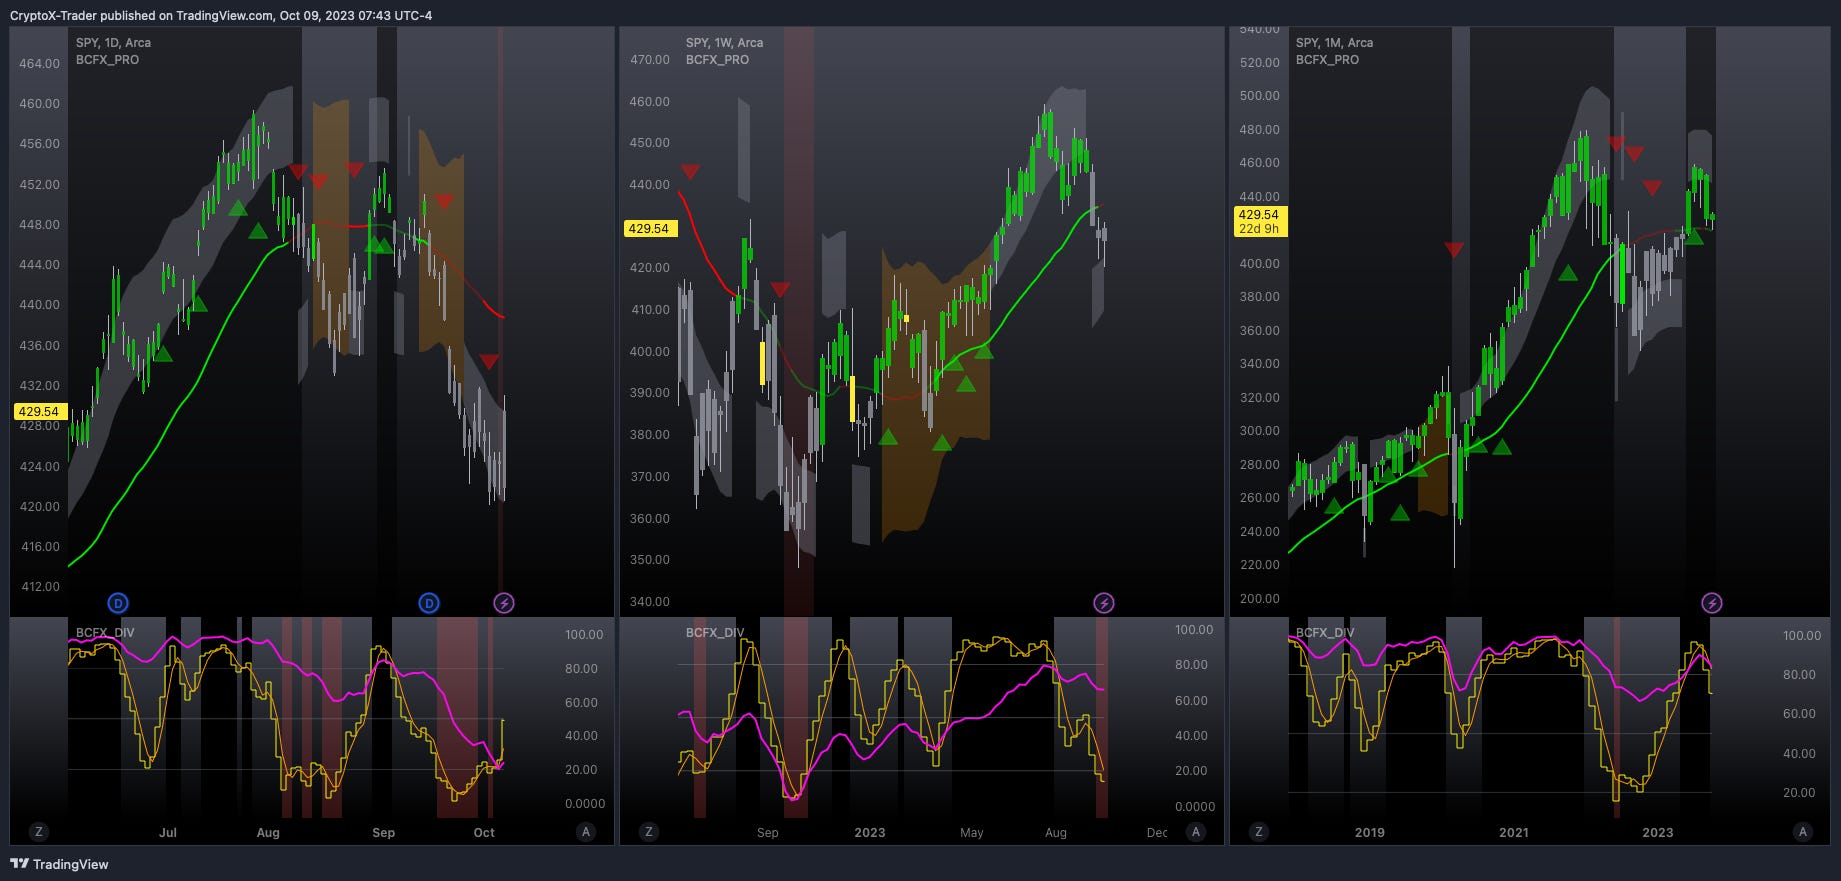
Refer to the HTF chart above:
The primary trend exhibits bearish behavior. In the divergence indicator, both the monthly and weekly yellow lines create lower lows.
The secondary trend exhibits bearish tendencies, but the price action plans to establish higher highs. Let's dissect this in the chart below.
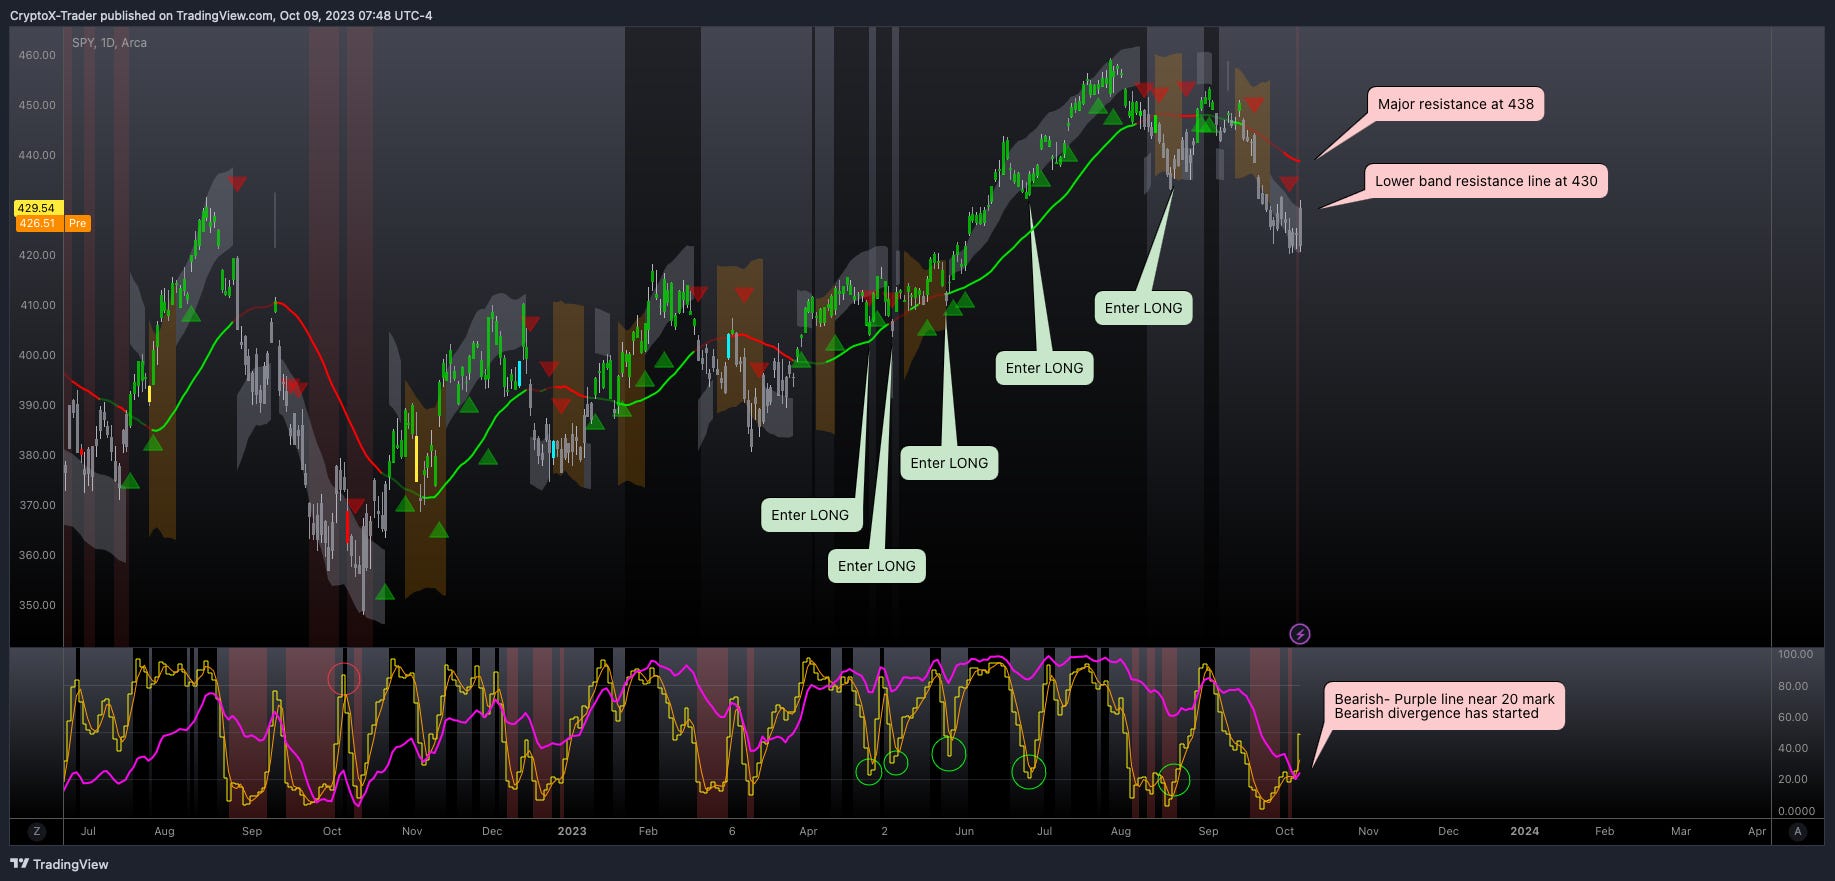
Refer to the daily chart above:
Resistance / Support: In this case,
Trading line acts as major resistance (438).
Bollinger bands outer and inner band lines also act as resistance (430).
April to September:
The purple line in the lower section consistently surpassed the 80 mark, indicating a bullish trend.
Bullish divergence cycles, indicated by the green circles in the chart's lower section, mark the entry points for opening a long position.
In september, the trend changed when purple line moved from 80 to 50 mark.
October:
Purple line is near 20 mark indicating a bearish trend and the yellow line has started to form a bearish divergence cycle.
Let the bearish divergence cycle form. As the yellow line rises from 50 to 80, it would cause the price action to create higher highs and reach the next resistance at 438. Experienced traders should short the highs as soon as the yellow line starts flattening or falling to lower lows.

Refer to the 4 hour chart above:
This timeframe showed 2 opportunities to short by trading the divergence.
Red circles mark the bearish divergence cycle, serving as entry points to initiate a short position.
Please note that these divergence cycles carry high risk and show weakness because the purple line doesn't sit near the 20 mark, but rather hovers around the 50 mark. This exemplifies how a trader can actively utilize the divergence indicator for enhanced risk management. If the risk is high, they should use small position size and tighten their stop loss.
The next step in this chart involves waiting for the formation of the bearish divergence cycle. When the yellow line flattens at the 80 mark, and creates the first low, evaluate if the purple line is still close to the 20 mark. Confirming this situation indicates a strong bearish divergence, permitting you to initiate a short. Keep a keen eye on the daily chart bearish divergence since it can supersede the setup on any lower timeframes. It's crucial to maintain vigilance.
If you find this helpful, please comment the next ticker symbol you would like me to analyze for the upcoming blog.