
Chart Analysis #4 $BTC Weekly

📊 Technical Analysis
Visit my previous blog if you're interested in my trading strategy!
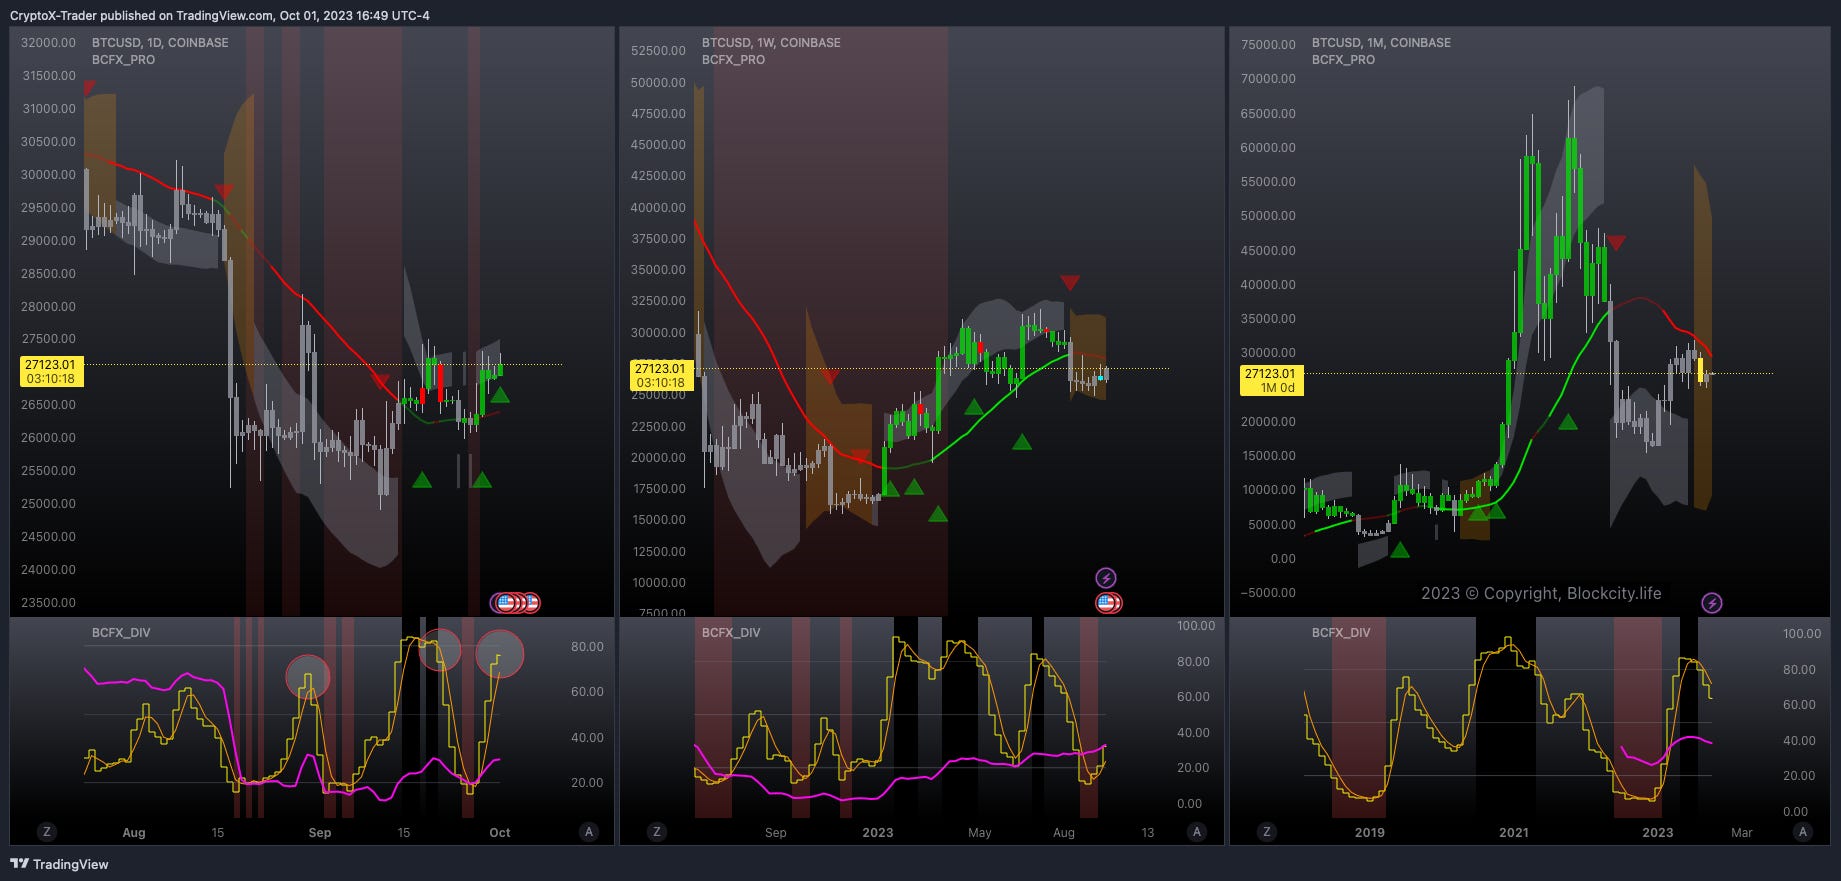
Trend Status
Primary trend (monthly, weekly) is bearish 🔻
The secondary trend (daily) is showing a bearish divergence cycle (marked in red circle).
✍️ TLDR Daily Chart
The primary trend (monthly chart) shifted to bearish on Sep 1, 2023. From that point, the daily chart has signaled 3 swing trades (shorts marked as red circle) as shown in above chart. Once the yellow line flattens or closes lower, experienced traders will short the highs and trade the divergence on the daily chart.
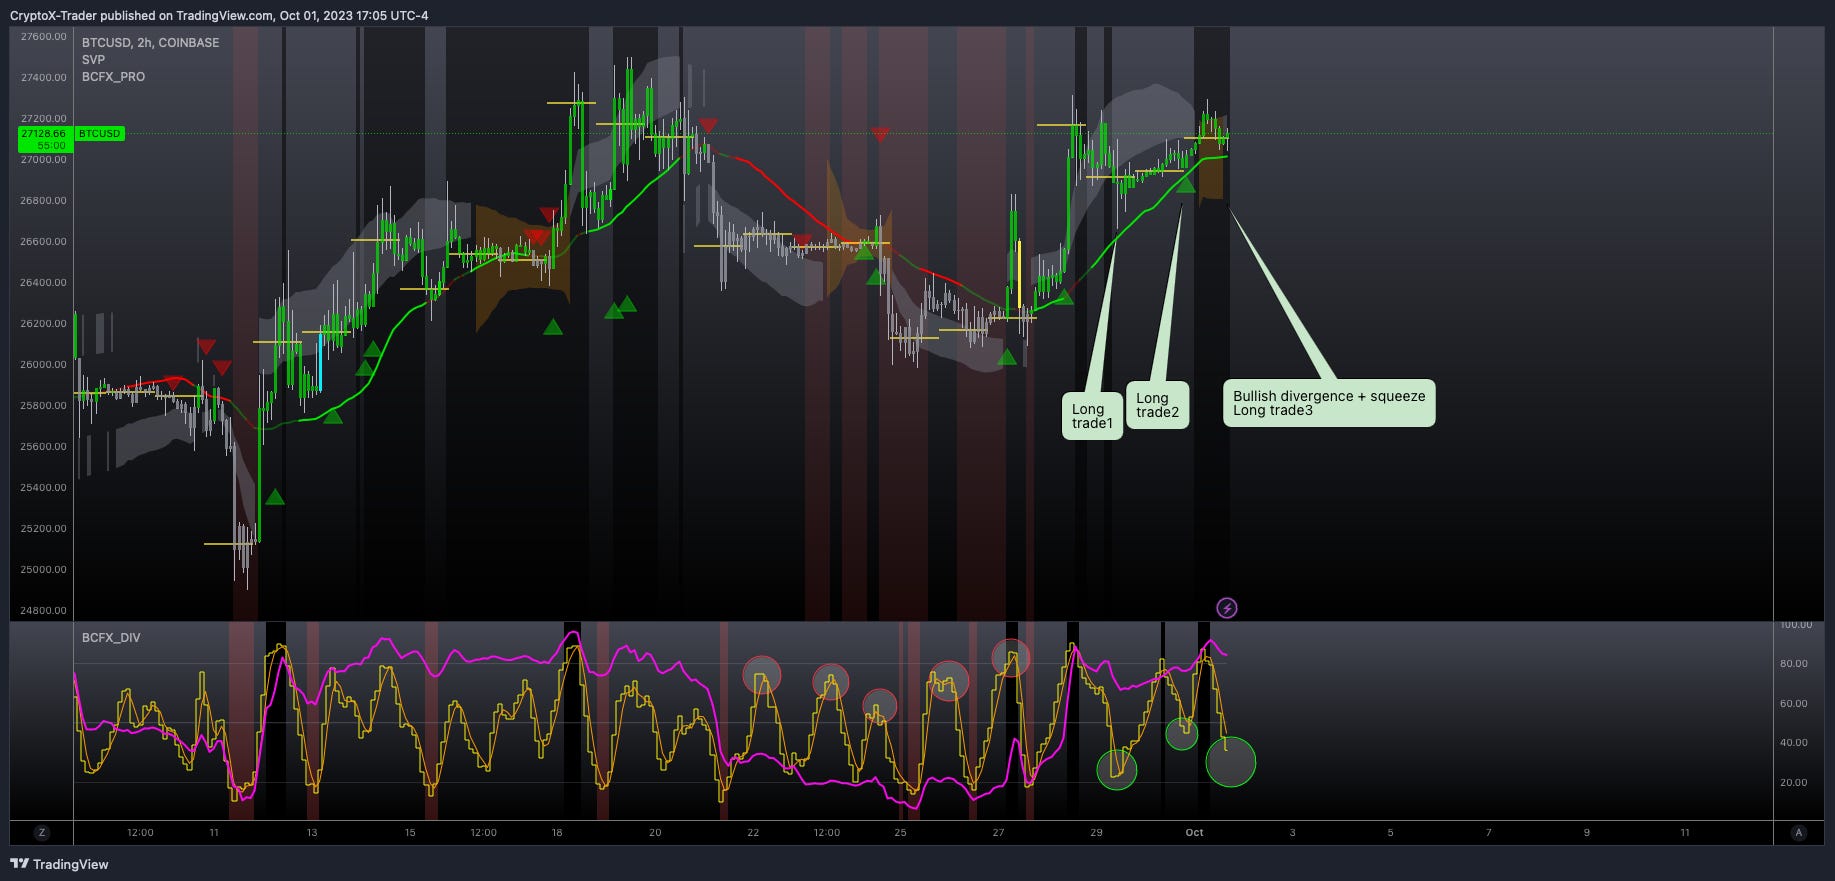
✍️ TLDR 2 Hour Chart
The 2H chart forms higher highs while the purple line approaches the 80 mark and the yellow line completes two divergence cycles. Currently, this chart is forming another divergence cycle. We can anticipate bullish price action for the next 8-12 hours after which the bearish divergence on the daily chart will override the LTF.